pyF1
Something for F1 passionate.
Checkout GitHub repository pyF1 repository
… or have a look at what it is used for Abu Dhabi 2021: To tow or not to tow
Intro
pyF1 python project provides some functions that make analysing F1 a bit easier It uses telemetry and other data provided by fastf1 by theOehrly and presents it in a more digestible way. However, you can find here much more, as I will be posting here some F1 related analysis with source code available in the repo - something for real nerds.
Demo
A brief demonstration of what it is all about.
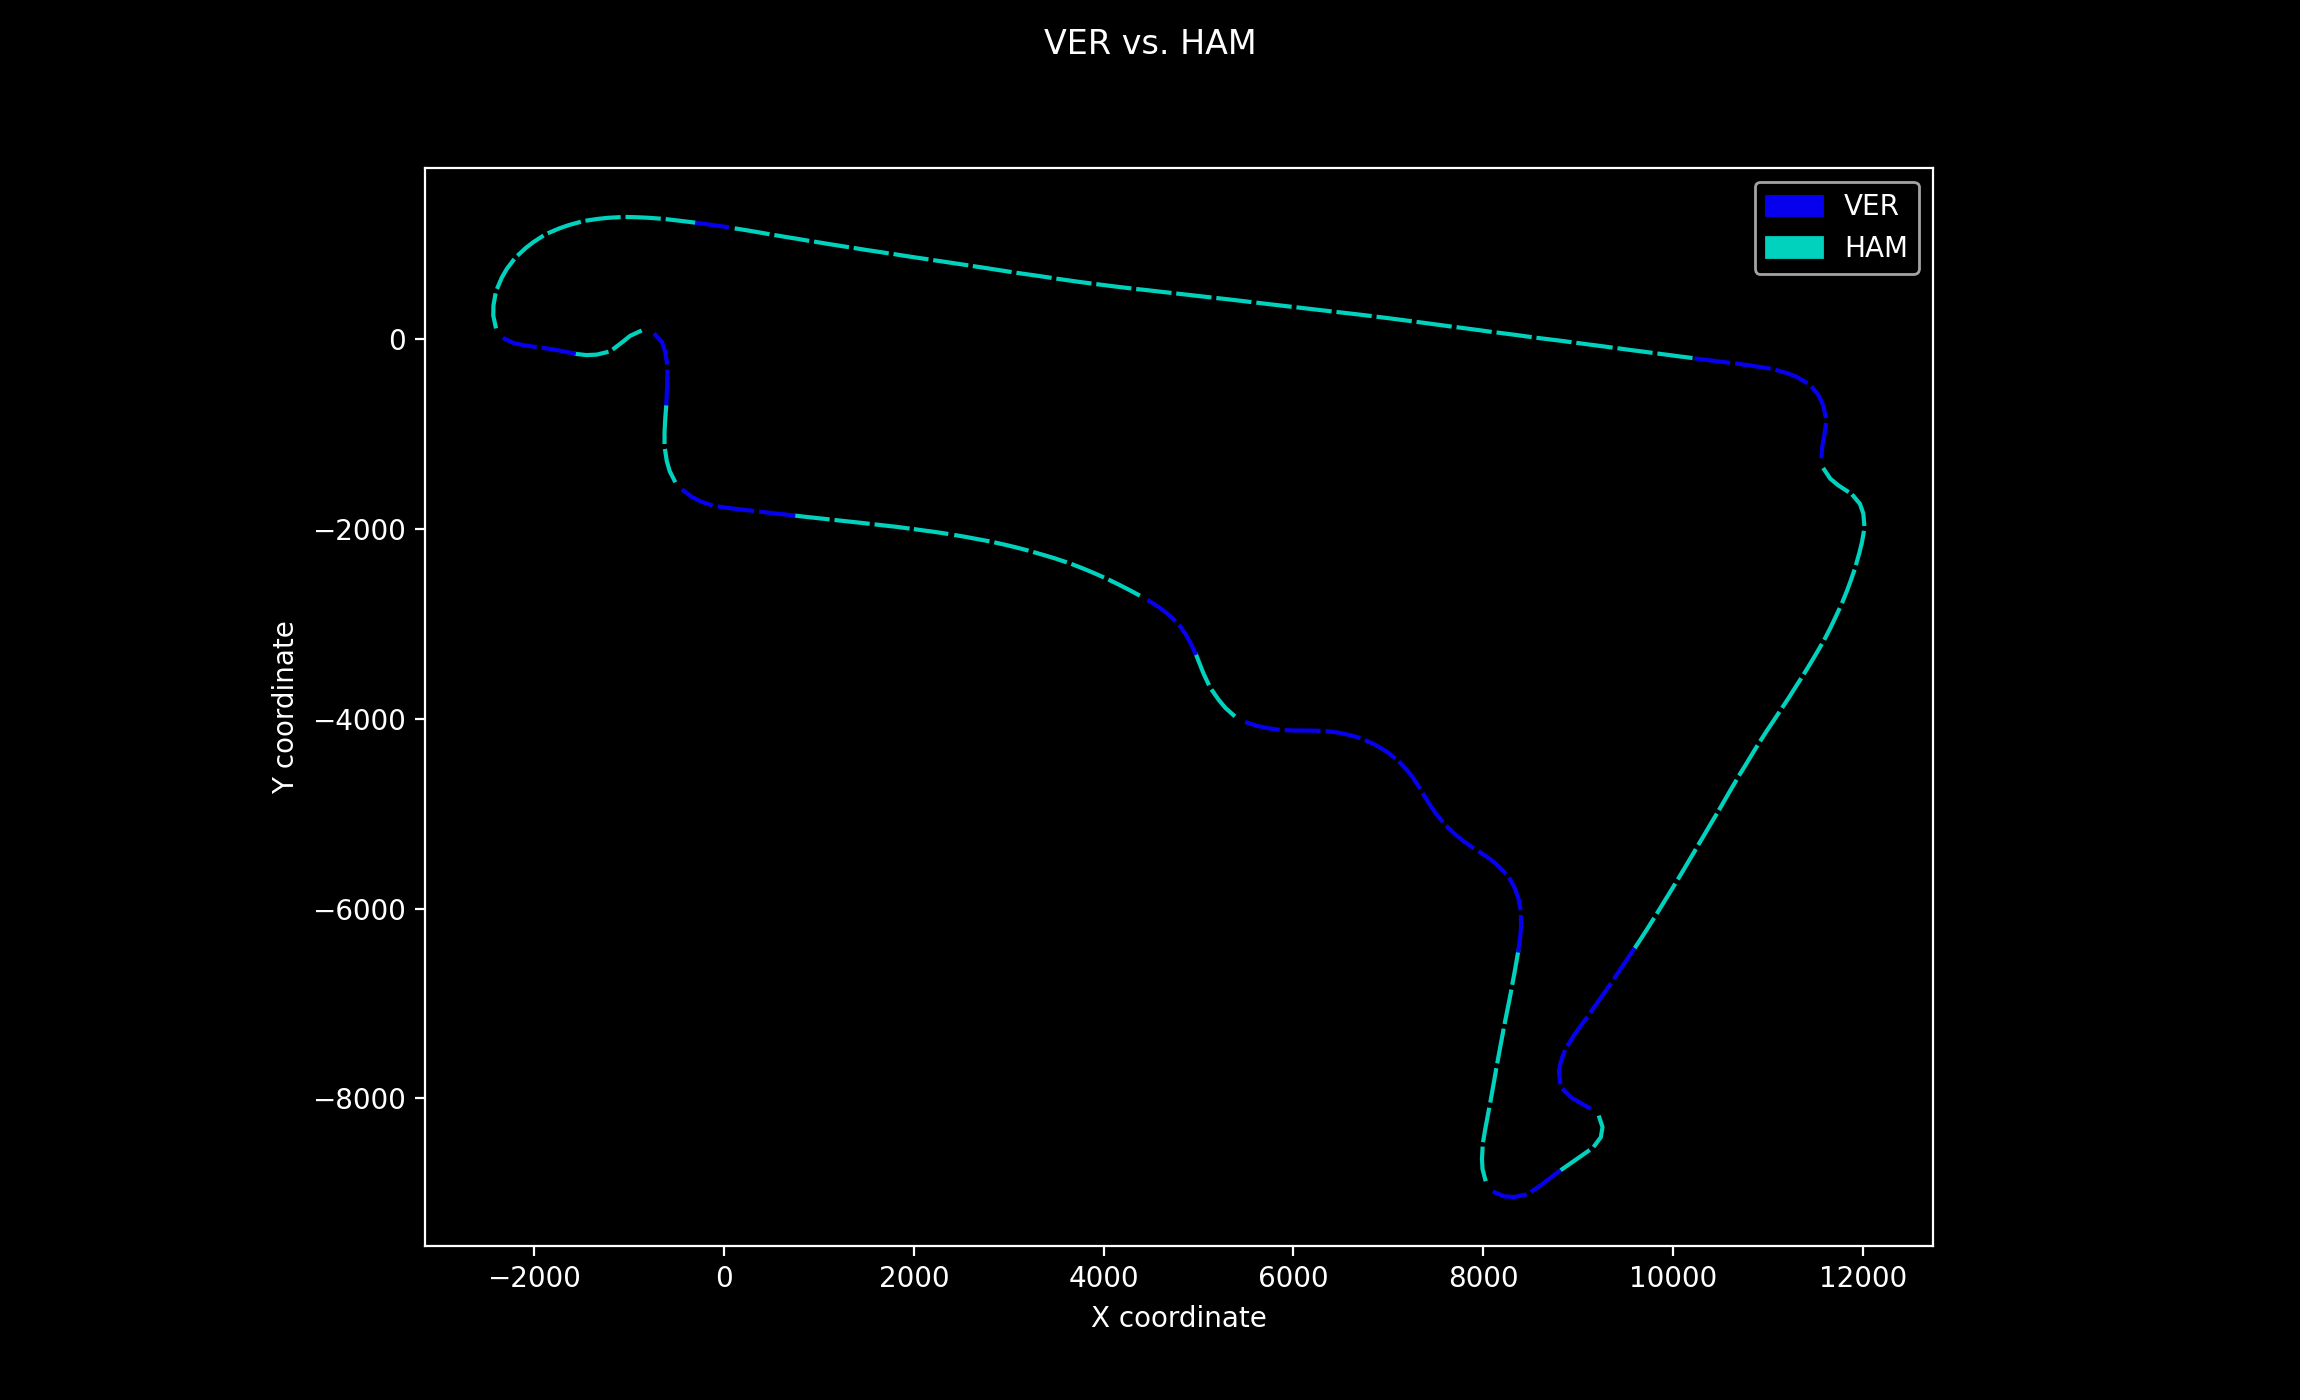
Let’s see in which part of the track Max Verstappen was faster than Lewis Hamilton
during qualifying for Mexico GP 2021. We are comparing their fastest laps.
We need to use following code:
from path.source import track_telemetry as tt
driver_list = ['VER', 'HAM']
laps, event = tt.crate_event(2021, 'Mexico', 'Q')
tt.overlay_map_multi(driver_list, laps)
The output is a plot with track map where mini sectors are colored depending on who was faster.

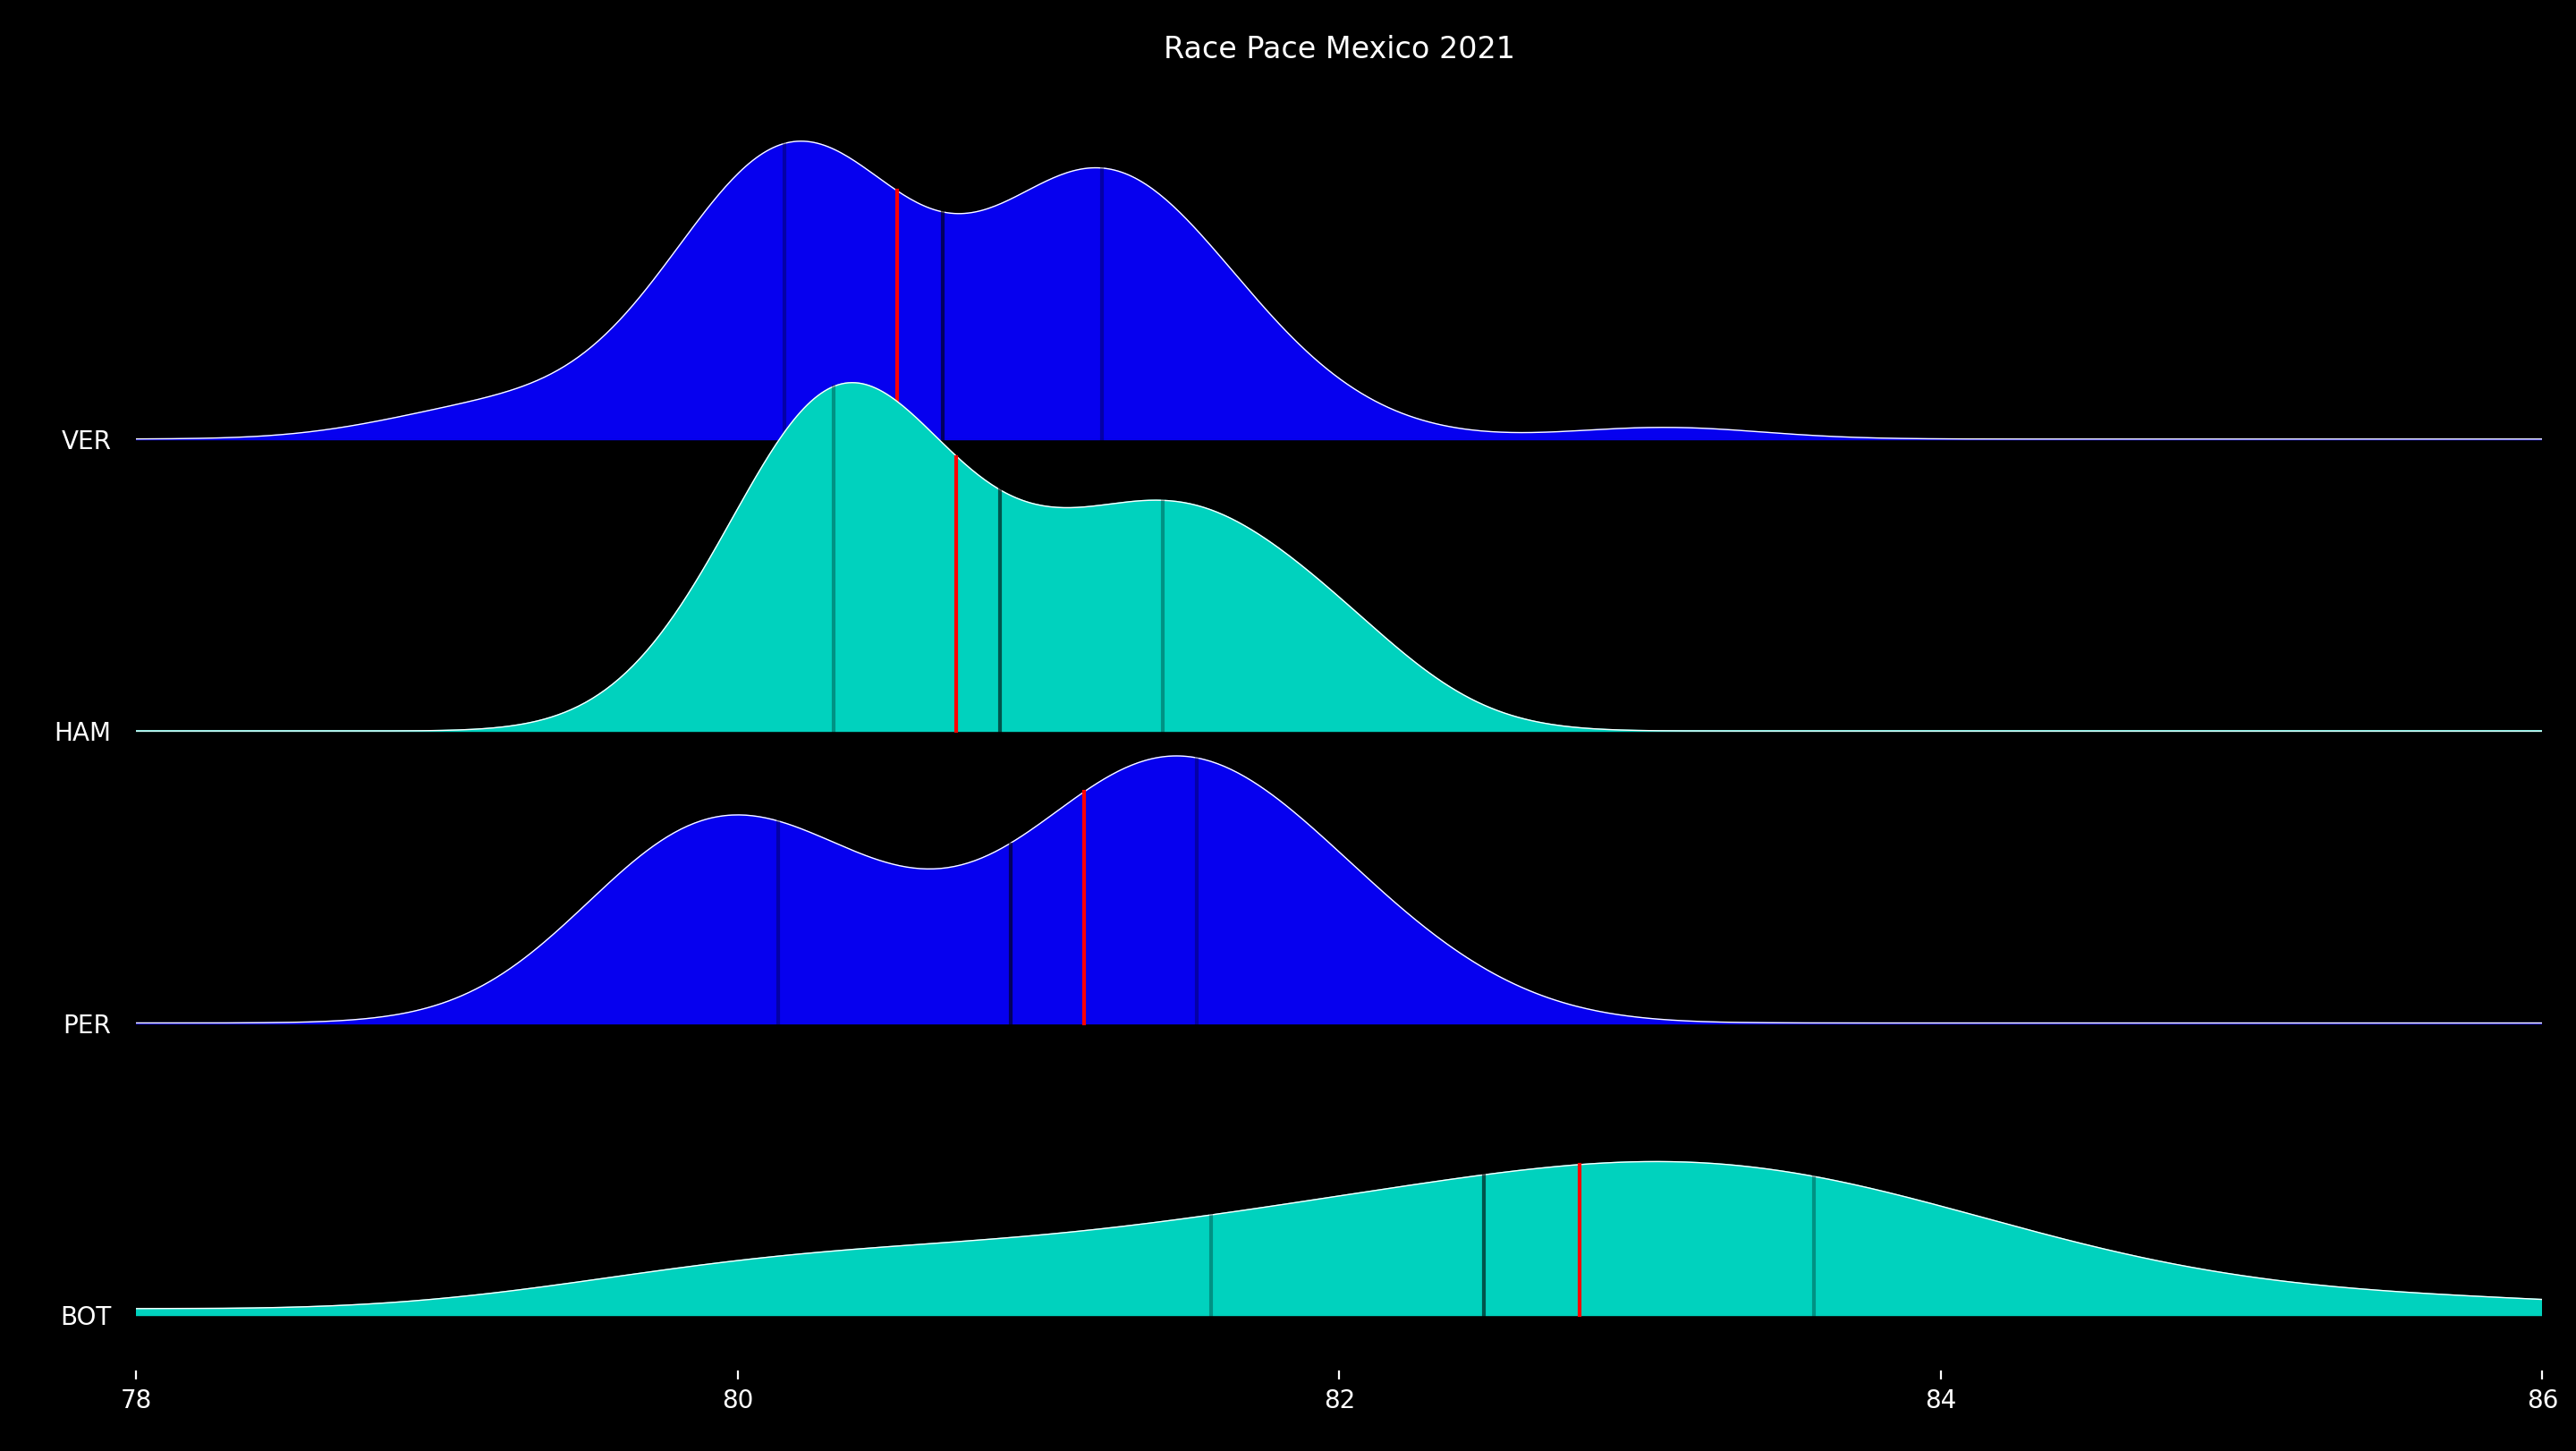
That seems easy, so let’s try something different. Let’s say that we would like to see how dominant was Red Bull over Mercedes in 2021 Mexico GP. We can use this short code:
laps, event = tt.crate_event(2021, 'Mexico', 'R')
drivers_list = ['VER', 'HAM', 'PER','BOT']
tt.ridgeline(drivers_list, laps, "Mexico 2021 - How Fast was Redbull?", None, None, 0)
The output is the following rigdeline graph and console printout with basic statistical info about distribution (median, average, quantile) of all valid laps driven in the race:

Median:
VER 80.5295
HAM 80.727
PER 81.151
BOT 82.7985Average:
VER 80.681328
HAM 80.873143
PER 80.906313
BOT 82.481466Quantile 25:
VER 80.15575 HAM 80.3195
PER 80.136
BOT 81.57325Quantile 75:
VER 81.2125
HAM 81.414
PER 81.52525
BOT 83.579
Documentation
Some basic docs can be found in documentation post
License
Copyright 2022, michalcie
